Business intelligence software turns operational data into dashboards, reports, models, exploration, and decisions. The challenge is that the category now includes everything from inexpensive open source dashboards to governed enterprise semantic layers and AI assisted analytics. United States companies should not pick a BI product from chart screenshots. The real questions are who creates content, who consumes it, where data lives, how definitions are governed, how securely users access it, and what the platform costs when adoption expands beyond a small analyst group.
This guide targets best business intelligence and dashboard tools for United States buyers and also covers related searches such as business intelligence tools, dashboard software, BI platforms, data visualization tools, self service analytics software, business dashboards. The structure was informed by recurring sections in current ranking comparison pages, including quick picks, product comparisons, methodology, detailed reviews, buying criteria, tradeoffs, and frequently asked questions. Product facts and pricing models were checked against current official vendor pages wherever public information is available.
Quick Recommendations
- Microsoft Power BI: Microsoft centered organizations that want broad self service BI at a low per user entry price
- Tableau: Visual exploration and analyst led dashboards where flexible data visualization matters
- Google Looker: Governed metrics and embedded analytics for teams building on Google Cloud
- Qlik Cloud Analytics: Associative exploration and governed enterprise analytics across varied data sources
- Sigma: Cloud warehouse teams that want spreadsheet familiar analysis on governed live data
- Domo: Companies that want BI combined with apps, workflows, connectors, and broad executive dashboards
- ThoughtSpot: Search and AI assisted analytics for business users asking questions of governed data
- Metabase: Startups and product teams that want straightforward dashboards with an open source option
Comparison Table
| Tool | Best for | Pricing approach | Important limitation |
|---|---|---|---|
| Microsoft Power BI | Microsoft centered organizations that want broad self service BI at a low per user entry price | Free desktop use available; Power BI Pro $14 per user monthly with annual billing; Premium Per User $24 | The licensing picture becomes more complex when organizations add Fabric capacity, Premium features, large models, embedded analytics, or many consumers. Governance is also essential because self service reports can multiply quickly. |
| Tableau | Visual exploration and analyst led dashboards where flexible data visualization matters | Viewer licenses start around $15 per user monthly annual; Creator authoring license around $75 per user monthly annual | Total cost depends heavily on the mix of Creator, Explorer, and Viewer users. Organizations should also test governance, performance, data preparation, and administration using production scale data rather than sample dashboards. |
| Google Looker | Governed metrics and embedded analytics for teams building on Google Cloud | Platform and user pricing is generally quote based for Standard, Enterprise, and Embed editions | Looker usually requires more modeling and data engineering discipline than lightweight dashboard tools. Pricing is quote based, so organizations should evaluate both platform cost and the engineering effort needed to maintain the semantic layer. |
| Qlik Cloud Analytics | Associative exploration and governed enterprise analytics across varied data sources | Starter $300 monthly for 10 users annual; Standard $825 monthly; Premium $2,750 monthly under current published tiers | Qlik administration and data modeling still require expertise. Buyers should test whether business users actually benefit from the associative model and how capacity, data volume, users, and automation affect total cost. |
| Sigma | Cloud warehouse teams that want spreadsheet familiar analysis on governed live data | License tiers include Lite, Essential, and Pro; commercial pricing is typically provided by account teams | Pricing is not a simple public per user list and the product is most valuable when a modern cloud warehouse already exists. Teams should evaluate warehouse compute cost alongside Sigma licensing. |
| Domo | Companies that want BI combined with apps, workflows, connectors, and broad executive dashboards | 30 day trial available; paid plans use consumption and credit based custom pricing | Consumption based pricing requires a realistic usage model. Organizations that only need a small number of dashboards may find a simpler BI product easier to justify and administer. |
| ThoughtSpot | Search and AI assisted analytics for business users asking questions of governed data | Essentials around $25 per user monthly annual; Pro can use credit based pricing; Enterprise custom | Natural language analytics does not remove the need for clean data and governed definitions. Buyers should test real business questions, ambiguous language, permissions, query cost, and whether users trust the answers. |
| Metabase | Startups and product teams that want straightforward dashboards with an open source option | Open Source edition is free; Starter about $100 monthly or $90 annual plus user charges; Pro from about $575 monthly before annual discount | Highly complex semantic modeling, enterprise governance, and broad self service programs may outgrow a simple deployment. Self hosting also creates operational responsibilities that should be included in total cost. |
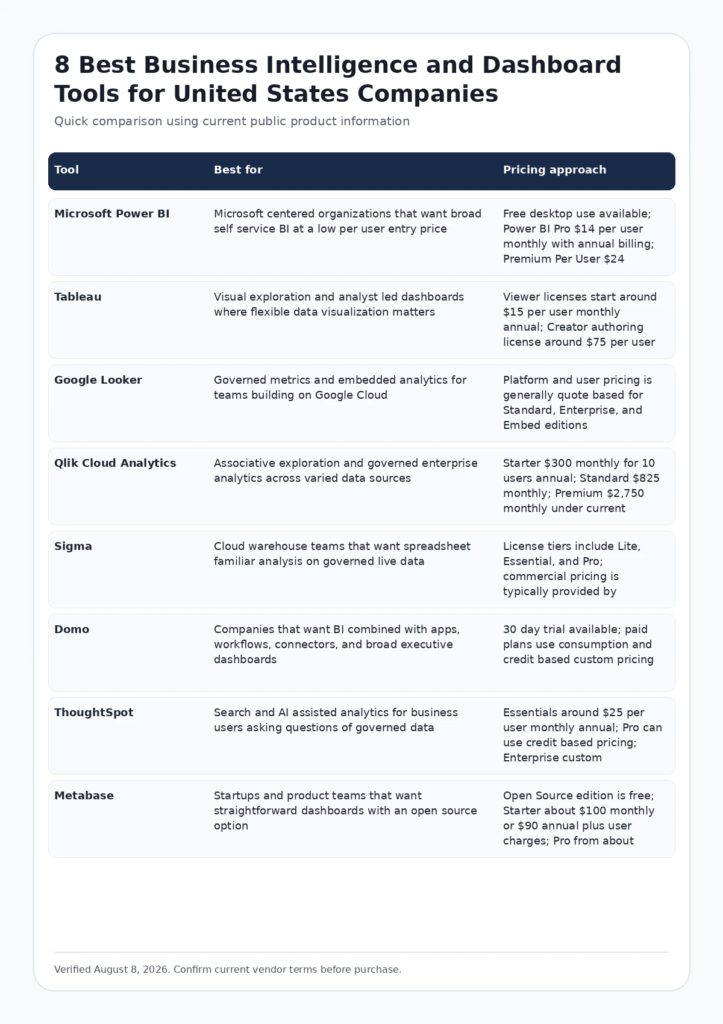
Infographic: Comparison Table
FCA_INFOGRAPHIC
Alt text: Comparison of leading best business intelligence and dashboard tools for United States buyers by use case and pricing approach.
How We Evaluated These Tools
- Search intent fit: the product must genuinely solve the job implied by the query rather than appear only because it is adjacent to the category.
- Workflow fit: we considered how naturally the platform connects to the people, systems, approvals, and operating model a US team already uses.
- Current evidence: official pricing, feature pages, documentation, and current authoritative research were favored over unsourced feature claims.
- Total cost: seat price was considered together with usage, credits, data volume, AI outcomes, compute, add ons, onboarding, and administration where relevant.
- Tradeoffs: each product includes a reason a buyer may choose something else. A useful comparison should clarify limitations rather than hide them.
Google recommends product review content that provides original analysis, evidence, meaningful comparisons, benefits, drawbacks, and useful links. See Google Search Central guidance for high quality reviews and Google guidance for helpful content.
Current Evidence and E E A T Signals
Microsoft current Power BI pricing lists Pro at $14 per user monthly with annual billing, showing why Power BI remains an accessible entry point for organizations that already use Microsoft data and productivity tools. Source: Microsoft Power BI pricing.
Metabase continues to offer an open source edition alongside paid cloud tiers, giving technical teams a useful reference point when comparing license cost with the operational cost of self hosting analytics. Source: Metabase pricing.
Detailed Reviews
1. Microsoft Power BI
Best for: Microsoft centered organizations that want broad self service BI at a low per user entry price
Power BI is one of the most widely adopted BI platforms because it combines a capable desktop authoring experience, cloud sharing, data modeling, Microsoft 365 integration, and a relatively accessible Pro license. It is particularly attractive to US organizations that already use Excel, Teams, Azure, Fabric, and Microsoft identity because analytics can fit inside a familiar administration environment.
Where Microsoft Power BI is strongest
- Strong value for organizations already standardized on Microsoft tools
- Power Query and semantic modeling support substantial data preparation and reusable metrics
- Large ecosystem of connectors, training, partners, templates, and community knowledge
Pricing and buying model
Free desktop use available; Power BI Pro $14 per user monthly with annual billing; Premium Per User $24. Check current official pricing
Limitations to consider
The licensing picture becomes more complex when organizations add Fabric capacity, Premium features, large models, embedded analytics, or many consumers. Governance is also essential because self service reports can multiply quickly.
Visit the official Microsoft Power BI website
2. Tableau
Best for: Visual exploration and analyst led dashboards where flexible data visualization matters
Tableau remains a strong choice for teams that value visual exploration and want analysts to build rich interactive dashboards without turning every question into a software development project. It supports many data sources, strong visualization flexibility, published data sources, server or cloud deployment, and a broad professional community.
Where Tableau is strongest
- Excellent visual exploration for analysts and data teams
- Mature ecosystem of skills, partners, connectors, and dashboard practices
- Role based licensing separates creators, explorers, and viewers for broader deployments
Pricing and buying model
Viewer licenses start around $15 per user monthly annual; Creator authoring license around $75 per user monthly annual. Check current official pricing
Limitations to consider
Total cost depends heavily on the mix of Creator, Explorer, and Viewer users. Organizations should also test governance, performance, data preparation, and administration using production scale data rather than sample dashboards.
Visit the official Tableau website
3. Google Looker
Best for: Governed metrics and embedded analytics for teams building on Google Cloud
Looker is differentiated by its modeled approach to business metrics. Instead of treating every dashboard as an independent definition of revenue, customer, or conversion, teams can define reusable logic in a governed semantic layer and use it across reports and applications. That makes Looker attractive to engineering and data teams that need consistent metrics and embedded analytics on top of a cloud data warehouse.
Where Google Looker is strongest
- Semantic modeling helps organizations define reusable governed business metrics
- Strong fit with Google Cloud and modern warehouse architectures
- Embedded analytics supports companies that expose data inside customer facing products
Pricing and buying model
Platform and user pricing is generally quote based for Standard, Enterprise, and Embed editions. Check current official pricing
Limitations to consider
Looker usually requires more modeling and data engineering discipline than lightweight dashboard tools. Pricing is quote based, so organizations should evaluate both platform cost and the engineering effort needed to maintain the semantic layer.
Visit the official Google Looker website
4. Qlik Cloud Analytics
Best for: Associative exploration and governed enterprise analytics across varied data sources
Qlik is known for an associative analytics engine that helps users explore relationships across data without relying only on fixed drill paths. Qlik Cloud Analytics combines dashboards, data preparation, automation, AI capabilities, alerts, and governed analytics. It is relevant for companies that want structured enterprise BI but still expect business users to explore data flexibly.
Where Qlik Cloud Analytics is strongest
- Associative exploration is useful when analysts need to investigate relationships across data
- Cloud platform combines dashboards, automation, alerts, and governed analytics
- Published tiers give buyers a clearer budget starting point than many enterprise BI vendors
Pricing and buying model
Starter $300 monthly for 10 users annual; Standard $825 monthly; Premium $2,750 monthly under current published tiers. Check current official pricing
Limitations to consider
Qlik administration and data modeling still require expertise. Buyers should test whether business users actually benefit from the associative model and how capacity, data volume, users, and automation affect total cost.
Visit the official Qlik Cloud Analytics website
5. Sigma
Best for: Cloud warehouse teams that want spreadsheet familiar analysis on governed live data
Sigma brings a spreadsheet style interface to cloud data platforms so business users can work with large governed datasets without exporting everything into local spreadsheets. This is useful for finance, operations, product, and business teams that understand spreadsheet logic but need central data, permissions, scale, and collaborative applications.
Where Sigma is strongest
- Spreadsheet familiar interface reduces the learning curve for many business users
- Works directly with modern cloud data platforms rather than relying on desktop extracts
- Supports dashboards, workbooks, data applications, input tables, and collaborative workflows
Pricing and buying model
License tiers include Lite, Essential, and Pro; commercial pricing is typically provided by account teams. Check current official pricing
Limitations to consider
Pricing is not a simple public per user list and the product is most valuable when a modern cloud warehouse already exists. Teams should evaluate warehouse compute cost alongside Sigma licensing.
Visit the official Sigma website
6. Domo
Best for: Companies that want BI combined with apps, workflows, connectors, and broad executive dashboards
Domo positions itself as a broad data and business platform rather than only a visualization tool. It includes connectors, data preparation, dashboards, apps, workflow, AI, alerts, and embedded experiences. The platform can work well when executives and operating teams need one environment that moves from data connection to action without assembling many separate products.
Where Domo is strongest
- Broad connector and application ecosystem can reduce integration work
- Combines dashboards with workflows, alerts, apps, and operational actions
- Unlimited user approaches can be attractive when many people consume analytics
Pricing and buying model
30 day trial available; paid plans use consumption and credit based custom pricing. Check current official pricing
Limitations to consider
Consumption based pricing requires a realistic usage model. Organizations that only need a small number of dashboards may find a simpler BI product easier to justify and administer.
Visit the official Domo website
7. ThoughtSpot
Best for: Search and AI assisted analytics for business users asking questions of governed data
ThoughtSpot focuses on making analytics accessible through search, natural language, AI assisted exploration, and interactive insights on cloud data. It is a strong candidate when an organization wants more employees to ask questions directly instead of waiting for an analyst to build every dashboard.
Where ThoughtSpot is strongest
- Search and conversational analytics lower the barrier for ad hoc business questions
- Strong connection to modern cloud data platforms and governed enterprise data
- Embedded and developer options support analytics inside applications and workflows
Pricing and buying model
Essentials around $25 per user monthly annual; Pro can use credit based pricing; Enterprise custom. Check current official pricing
Limitations to consider
Natural language analytics does not remove the need for clean data and governed definitions. Buyers should test real business questions, ambiguous language, permissions, query cost, and whether users trust the answers.
Visit the official ThoughtSpot website
8. Metabase
Best for: Startups and product teams that want straightforward dashboards with an open source option
Metabase is popular because it gives teams a relatively simple path from a database to dashboards and questions. The open source edition can be self hosted, while commercial cloud plans add administration, permissions, embedding, support, and enterprise features. It is a strong fit for startups and technical teams that want useful BI without the implementation weight of a large enterprise platform.
Where Metabase is strongest
- Open source edition creates a low cost path to internal analytics
- Simple query and dashboard experience is approachable for smaller teams
- Commercial plans add governance, embedding, SSO, and support as requirements mature
Pricing and buying model
Open Source edition is free; Starter about $100 monthly or $90 annual plus user charges; Pro from about $575 monthly before annual discount. Check current official pricing
Limitations to consider
Highly complex semantic modeling, enterprise governance, and broad self service programs may outgrow a simple deployment. Self hosting also creates operational responsibilities that should be included in total cost.
Visit the official Metabase website
How to Choose the Right Platform
A useful analytics platform should make trusted data easier to explore without creating new definitions of the same business metric.
Start with business decisions and metric definitions
List the decisions dashboards must support and define the metrics before evaluating visualization features. A beautiful dashboard with inconsistent revenue or customer definitions creates more arguments, not better decisions.
Separate authors from consumers
Count analysts who build models, power users who explore, managers who interact, and viewers who only consume. Role and capacity licensing can produce very different costs at scale.
Test production data volume and concurrency
A demo with a small extract says little about real performance. Test large models, row level security, peak users, refresh, direct queries, warehouse cost, exports, and embedded workloads.
Evaluate governance and self service together
Good BI makes trusted data easier to use without giving every user permission to redefine core metrics. Review semantic models, certified sources, lineage, permissions, audit, versioning, and change management.
Relevant Futuristic Coding Academy Resources
For related technical, analytics, marketing, and software context, explore data science learning guide, full stack Python guide, full stack developer roadmap, Futuristic Coding Academy blog library, and the Futuristic Coding Academy.
Frequently Asked Questions
What is business intelligence software?
Business intelligence software connects to business data and helps users model, analyze, visualize, report, and share information through dashboards, reports, alerts, or interactive exploration.
What is the best BI tool for a small business?
Power BI and Metabase are practical starting points because they offer accessible pricing and relatively fast deployment. The best option depends on existing data sources, technical skills, and how many people need access.
What is the best BI platform for enterprise companies?
Power BI, Tableau, Looker, Qlik, ThoughtSpot, Sigma, and Domo can all support enterprise use cases. The choice depends on cloud strategy, semantic modeling, governance, user roles, embedded requirements, and existing technology.
What is the difference between BI and a dashboard tool?
A dashboard tool focuses on displaying metrics and charts. A full BI platform may also include data modeling, semantic layers, permissions, preparation, exploration, alerts, governance, AI, APIs, and embedded analytics.
Is Power BI cheaper than Tableau?
Power BI Pro has a lower published per user entry price than a Tableau Creator license. Total cost depends on the mix of creators and viewers, capacity, data infrastructure, and advanced features, so buyers should model the full deployment.
What is a semantic layer in BI?
A semantic layer defines business metrics, relationships, dimensions, and logic in a reusable form so different reports and users do not calculate important measures in conflicting ways.
Can business users build their own dashboards?
Yes. Most modern platforms offer self service creation, but organizations should provide certified data, definitions, templates, permissions, and training so self service does not become uncontrolled metric duplication.
How should a company test a BI platform?
Use real data, real metric definitions, representative user roles, row level security, production sized models, peak query loads, dashboard creation tasks, exports, and executive questions. Measure both performance and administration effort.
Does AI make BI easier to use?
Conversational and AI assisted analytics can help users formulate questions, generate calculations, summarize insights, and build charts. Reliable answers still depend on data quality, permissions, and governed business definitions.
What data sources should a BI platform support?
The platform should connect to the systems the company actually uses, including cloud warehouses, relational databases, SaaS applications, files, and operational systems. Native access patterns and refresh behavior matter as much as the connector list.
What BI security features matter?
Look for single sign on, role based access, row and column security, audit logs, data residency options, encryption, certified content, service account control, and integration with existing identity systems.
How often should dashboards be refreshed?
Refresh should match the business decision. Executive financial dashboards may update daily, operational monitoring can require minutes, and strategic market reports may only need weekly or monthly updates. Faster is not always more useful.
Final Recommendation
The best choice among Microsoft Power BI, Tableau, Google Looker, Qlik Cloud Analytics, Sigma, Domo, ThoughtSpot, Metabase depends on the operating problem, existing software stack, team skills, governance requirements, and the cost model at realistic usage. Use a short list of two or three products, test them with representative work, verify current pricing and contract terms, and measure a business outcome rather than a feature count. The strongest platform is the one that improves a real workflow with acceptable risk, cost, and administration.
Editorial note: Product features and pricing change frequently. This guide was verified on August 8, 2026. Confirm current terms on the linked official vendor pages before purchasing.