Observability tools help engineering teams answer a harder question than whether a server is up. They help explain why a distributed application is slow, which service introduced an error, what changed before an incident and how customer experience is affected. For developers working through the application architecture in FCA’s Java full stack guide or full stack web development roadmap, observability becomes increasingly important as applications add services, queues, containers and managed cloud components.
Current US ranking pages consistently compare Datadog, New Relic, Grafana Cloud, Dynatrace, Honeycomb, Sentry, Elastic and Splunk, but the real differences are billing model, correlation depth, OpenTelemetry support, high cardinality analysis, developer workflow and operational complexity.
This guide evaluates those eight platforms for US engineering teams and uses public vendor pricing where it is clear. Observability bills are highly sensitive to telemetry volume, retention and host count, so every price should be treated as a starting point rather than a final monthly estimate.
- The shortlist is built for best application monitoring and observability tools intent in the United States.
- Each tool is matched to a specific workflow instead of receiving an artificial universal score.
- Public pricing is sourced from official vendor pages and custom pricing is labeled rather than estimated.
- A proof of concept with real workloads is more useful than choosing from feature counts alone.
Best options at a glance
| Tool | Best for | Starting price or model | Main consideration |
|---|---|---|---|
| Datadog | Broad SaaS observability across large cloud environments | APM starts around $31 per host monthly with annual billing | Pricing is spread across several products and usage meters. Teams should model hosts, log ingestion, indexed spans, retention and optional modules before standardizing broadly. |
| New Relic | Teams that want broad observability with usage based data pricing | Free includes 100 GB monthly ingest, paid data starts around $0.40 per GB plus user costs | The combination of data, user and advanced compute pricing requires careful planning. Costs can change significantly as telemetry volume and full platform user count grow. |
| Grafana Cloud | OpenTelemetry and open source oriented teams | Free tier, Pro starts at $19 monthly plus usage, application observability from $0.025 per host hour | Understanding total cost requires estimating host hours and telemetry volume separately. Teams also need a clear data governance plan to prevent noisy telemetry from growing spend. |
| Dynatrace | Large enterprises that want automated topology and root cause analysis | Foundation about $7 per host monthly, Infrastructure about $29, Full Stack about $58 per 8 GiB host | The platform has considerable depth and can be more than small teams need. Cost planning should account for hosts, memory, logs, traces and optional digital experience monitoring. |
| Honeycomb | High context debugging and distributed tracing | Free up to 20 million events monthly, Pro starts at $150 monthly | Teams looking for a traditional all purpose infrastructure monitoring suite may need additional tools or integrations. Event volume still needs disciplined telemetry design. |
| Sentry | Developer centered error monitoring and application performance | Developer free, Team about $26 monthly, Business about $80 monthly | Sentry is not a replacement for every infrastructure, network or log management need. Large organizations often pair it with a broader observability platform. |
| Elastic Observability | Teams that want search, logs and observability on the Elastic platform | Elastic Cloud Hosted Standard starts around $99 monthly for a reference deployment | Sizing is architecture dependent, and a simple starting cloud price does not represent a production deployment with significant data volume and retention. |
| Splunk Observability Cloud | Large organizations combining observability with established Splunk operations | Custom pricing based on workload, hosts or usage model | Public pricing is not simple, so buyers need a tailored estimate. Smaller engineering teams may find lighter self service platforms easier to adopt and forecast. |
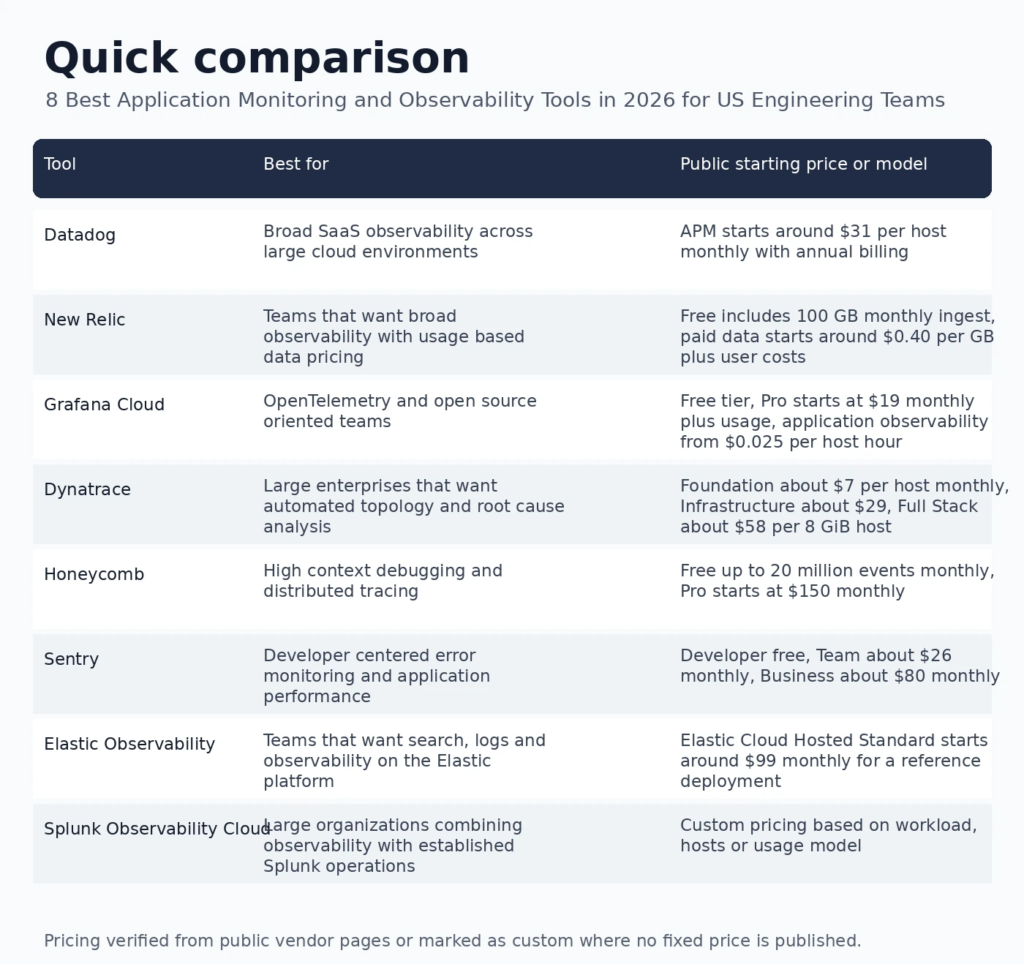
Infographic: Best options at a glance
How we evaluated these tools
We reviewed current ranking pages for APM and observability queries, then validated capabilities and prices through official vendor pages. We prioritized four signals: traces, metrics, logs and the ability to connect those signals to application context.
The OpenTelemetry signals documentation defines traces, metrics and logs as distinct telemetry signals and explains how they describe different views of a system. Its observability primer frames observability as the ability to answer new questions about a system from emitted telemetry rather than relying only on predefined checks. That is a useful standard for comparing modern platforms.
FCA readers can connect these ideas with the monitoring and deployment sections in the full stack roadmap and the Python full stack guide.
1. Datadog
Best for: Broad SaaS observability across large cloud environments
Datadog offers one of the broadest integrated observability portfolios, including infrastructure, APM, logs, RUM, synthetics, database monitoring and security products. Its main strength is correlation across signals and a mature integration ecosystem.
Why it stands out
- Strong metrics, logs and traces correlation
- Large cloud and SaaS integration catalog
- Useful service maps, RUM and synthetic monitoring
- Mature enterprise workflow and alerting
Pricing
APM starts around $31 per host monthly with annual billing. Confirm the current quote or calculator before purchase because usage and plan terms can change.
Limitations to consider
Pricing is spread across several products and usage meters. Teams should model hosts, log ingestion, indexed spans, retention and optional modules before standardizing broadly.
2. New Relic
Best for: Teams that want broad observability with usage based data pricing
New Relic combines APM, infrastructure, logs, browser monitoring, errors and other telemetry in one platform. Its pricing model separates data ingestion from user access, which can be attractive for organizations that want many integrations but need to control telemetry cost.
Why it stands out
- Broad full stack observability platform
- 100 GB free data ingest each month
- Large integration library
- Useful developer and service intelligence features
Pricing
Free includes 100 GB monthly ingest, paid data starts around $0.40 per GB plus user costs. Confirm the current quote or calculator before purchase because usage and plan terms can change.
Limitations to consider
The combination of data, user and advanced compute pricing requires careful planning. Costs can change significantly as telemetry volume and full platform user count grow.
3. Grafana Cloud
Best for: OpenTelemetry and open source oriented teams
Grafana Cloud packages hosted Grafana with managed metrics, logs, traces and profiles. It is a natural option for teams that already use Prometheus, Loki, Tempo or OpenTelemetry and want a managed path without abandoning open tooling.
Why it stands out
- Strong alignment with open source observability ecosystem
- Native OpenTelemetry and Prometheus support
- Useful free tier for evaluation and small workloads
- Flexible signal specific usage pricing
Pricing
Free tier, Pro starts at $19 monthly plus usage, application observability from $0.025 per host hour. Confirm the current quote or calculator before purchase because usage and plan terms can change.
Limitations to consider
Understanding total cost requires estimating host hours and telemetry volume separately. Teams also need a clear data governance plan to prevent noisy telemetry from growing spend.
4. Dynatrace
Best for: Large enterprises that want automated topology and root cause analysis
Dynatrace is designed for complex environments where automatic discovery, topology and root cause analysis are valuable. Its platform combines application, infrastructure, logs, digital experience and security related capabilities under a usage based subscription model.
Why it stands out
- Automatic topology and dependency mapping
- Strong enterprise scale automation
- Full stack monitoring with detailed rate card
- OpenTelemetry metrics and trace support
Pricing
Foundation about $7 per host monthly, Infrastructure about $29, Full Stack about $58 per 8 GiB host. Confirm the current quote or calculator before purchase because usage and plan terms can change.
Limitations to consider
The platform has considerable depth and can be more than small teams need. Cost planning should account for hosts, memory, logs, traces and optional digital experience monitoring.
5. Honeycomb
Best for: High context debugging and distributed tracing
Honeycomb is built around high context events and exploratory analysis, which makes it strong for engineers debugging distributed systems and unexpected production behavior. It emphasizes fast questions over wide event data rather than a traditional dashboard first monitoring model.
Why it stands out
- Strong distributed tracing and exploratory debugging
- OpenTelemetry support
- Unlimited seats and querying in current pricing model
- Good fit for high context production questions
Pricing
Free up to 20 million events monthly, Pro starts at $150 monthly. Confirm the current quote or calculator before purchase because usage and plan terms can change.
Limitations to consider
Teams looking for a traditional all purpose infrastructure monitoring suite may need additional tools or integrations. Event volume still needs disciplined telemetry design.
6. Sentry
Best for: Developer centered error monitoring and application performance
Sentry is especially strong at connecting errors, traces and releases to the code developers are already changing. It is a focused option for application teams that care more about software health and debugging than broad infrastructure operations.
Why it stands out
- Excellent developer workflow around errors and releases
- Application performance and tracing features
- Clear path from issue to source context
- Useful for web, mobile and backend application teams
Pricing
Developer free, Team about $26 monthly, Business about $80 monthly. Confirm the current quote or calculator before purchase because usage and plan terms can change.
Limitations to consider
Sentry is not a replacement for every infrastructure, network or log management need. Large organizations often pair it with a broader observability platform.
7. Elastic Observability
Best for: Teams that want search, logs and observability on the Elastic platform
Elastic Observability uses the Elastic search and analytics stack for logs, metrics, traces and application monitoring. It is attractive when the organization already uses Elastic for search or security and wants to consolidate telemetry on the same data platform.
Why it stands out
- Strong log search and analytics foundation
- APM, metrics and traces on one data platform
- Flexible deployment choices
- Good fit for existing Elastic users
Pricing
Elastic Cloud Hosted Standard starts around $99 monthly for a reference deployment. Confirm the current quote or calculator before purchase because usage and plan terms can change.
Limitations to consider
Sizing is architecture dependent, and a simple starting cloud price does not represent a production deployment with significant data volume and retention.
8. Splunk Observability Cloud
Best for: Large organizations combining observability with established Splunk operations
Splunk Observability Cloud combines infrastructure monitoring, APM, real user monitoring and synthetic monitoring. It is most compelling for enterprises that already use Splunk products and want telemetry connected to a broader operations or security ecosystem.
Why it stands out
- Enterprise scale observability capabilities
- Strong integration with broader Splunk ecosystem
- APM, infrastructure and digital experience options
- Suitable for large operations teams
Pricing
Custom pricing based on workload, hosts or usage model. Confirm the current quote or calculator before purchase because usage and plan terms can change.
Limitations to consider
Public pricing is not simple, so buyers need a tailored estimate. Smaller engineering teams may find lighter self service platforms easier to adopt and forecast.
How to choose the right platform
Start with telemetry architecture rather than a vendor demo. List the signals you already produce, where they are stored, how long they must be retained and which teams actually query them. OpenTelemetry can reduce instrumentation lock in, but storage, analytics and user workflow still differ significantly between platforms.
Next, decide what problem matters most. If the pain is application debugging, Sentry or Honeycomb may produce faster value. If the organization needs broad infrastructure, logs, APM and cloud integrations, Datadog, New Relic, Grafana Cloud, Dynatrace, Elastic or Splunk deserve closer evaluation.
Cost tests should use real telemetry. Run a representative service for several weeks and estimate host hours, log volume, trace volume, metric cardinality, retention and full user access. A cheap starting tier does not matter if normal production volume produces an unexpected bill.
Finally, evaluate incident workflow. A good platform should help an engineer move from an alert to the responsible service, deployment, trace and relevant logs without searching five dashboards. The deployment concepts in FCA’s web development roadmap provide useful context for why release markers and service ownership matter.
Questions to ask before you buy
- Which workflows will this product replace or improve?
- What usage metric actually determines the monthly bill?
- Which features require a higher plan or an add on?
- How will the platform fit existing source control, identity, analytics or security systems?
- What data leaves your environment and how long is it retained?
- Can the team export configuration and data if it later changes vendors?
Frequently asked questions
What is the best observability tool overall?
Datadog is a strong broad SaaS choice, but there is no universal winner. Grafana Cloud fits open tooling, Honeycomb fits deep distributed debugging, Dynatrace fits enterprise automation and Sentry fits developer centered application monitoring.
What is the difference between APM and observability?
APM traditionally focuses on application performance and transactions. Observability is broader and uses telemetry such as traces, metrics and logs to investigate known and unexpected system behavior across applications and infrastructure.
Why is OpenTelemetry important?
OpenTelemetry provides common instrumentation and export standards for telemetry. It can reduce dependence on vendor specific agents and makes it easier to send signals to different backends, although backend query and pricing models still differ.
Are logs, metrics and traces all necessary?
They answer different questions. Metrics show trends and health, logs record events and traces show the path of a request across services. Many incidents require context from more than one signal.
Which observability tool is best for a small team?
New Relic and Grafana Cloud have useful free tiers, while Sentry can be excellent for application focused teams. The best choice depends on whether the team needs infrastructure breadth or mainly developer debugging.
How does Datadog compare with New Relic?
Datadog offers a very broad modular platform with extensive integrations. New Relic emphasizes a combined observability platform with data and user based pricing. Cost depends heavily on the specific telemetry profile.
Is Sentry a full observability platform?
Sentry covers errors, performance and tracing with a strong developer focus. It can be the primary application monitoring tool for many teams, but organizations may still need separate infrastructure, network or large scale log tooling.
What causes observability cost to grow quickly?
High log volume, excessive trace retention, high cardinality metrics, many monitored hosts and duplicated telemetry are common cost drivers. Sampling, filtering, retention rules and ownership help keep spend controlled.
What is high cardinality in observability?
High cardinality means a field can have many distinct values, such as customer IDs or request IDs. It can be extremely useful for debugging but can also increase storage or query cost depending on the platform.
Should teams monitor real user experience?
If customer experience matters, real user monitoring can reveal browser performance, page errors and geographic differences that backend monitoring alone cannot show. It is especially useful for web applications with significant front end logic.
How long should observability data be retained?
Retention should match operational, compliance and investigation needs. Keep high detail telemetry long enough to investigate realistic incidents, then use lower cost archives or aggregated data for longer historical analysis when appropriate.
How should a US engineering team run an observability proof of concept?
Instrument representative services, include a real incident scenario, measure time to answer troubleshooting questions, estimate the production bill and involve both developers and operations teams before making a platform decision.
Final verdict
There is no single winner for every organization. The best choice is the product that fits the existing workflow, produces useful outcomes with manageable operational effort and has a pricing model the team can forecast. Start with two or three candidates, test them on representative work and document the decision criteria before committing to a long contract.
For more software and development research, explore the Futuristic Coding Academy blog and the full stack developer roadmap.